Below is a guide to help you interpret each section and use the data to make informed decisions about your email strategy.
Use your Orita Dashboard to:
-
Monitor performance trends over time using the revenue lift and engagement summaries.
-
Validate reactivation success by reviewing rescued and reactivated revenue.
-
Protect your list health with insight into bot suppression and unsubscribe prevention.
-
Optimize send strategy by adjusting targeting based on engagement levels.
-
Demonstrate ROI to your broader team or stakeholders with clear, measurable impact.
🏃♀️Quick View
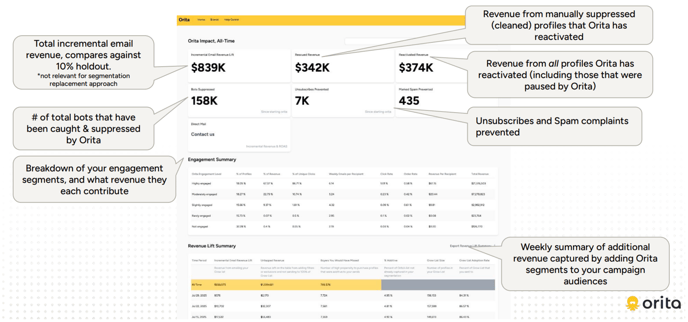
💰 Revenue Impact
Incremental Email Revenue Lift
This shows how much additional revenue you’ve earned from following Orita’s recommendations compared to your control group.
-
Why it matters: This is your clearest measure of Orita’s impact.
-
Tip: Track changes in this number over time to see the effect of new segments, seasonal activity, or strategy shifts.
Rescued™️ Revenue
Revenue recovered from profiles that were previously brand-suppressed but reactivated by Orita.
-
Why it matters: This shows the money regained by safely bringing back valid, previously list cleaned profiles.
Reactivated Revenue
Revenue generated from all profiles Orita has reactivated, including those originally paused by Orita or manually suppressed in Klaviyo.
-
Why it matters: This highlights the value of Orita’s reactivation strategy bringing profiles back during their engagement cycles and tracking conversions.
🛡️ List Protection
Bots Suppressed
Total number of fake, duplicate, or low-quality emails that Orita has identified and prevented from receiving sends.
-
Why it matters: This protects your sender reputation and ensures your campaigns reach real, engaged customers.
Unsubscribes and Spam Complaints Prevented
Estimated number of unsubscribes and spam complaints avoided thanks to Orita’s recommendations.
-
Why it matters: Protecting your sender reputation directly improves deliverability and long-term list health.
📊 Engagement Analysis
Engagement Summary
A breakdown of your list across five engagement levels: Highly, Moderately, Slightly, Rarely, and Not Engaged.
For each level, you’ll see:
-
% of profiles
-
% of revenue and clicks
-
Weekly emails per person
-
Click rate, order rate, and revenue per person
Why it matters: This helps you understand where most of your revenue is coming from and which cohorts are ready to hear from you via email.
-
Example: If “Slightly Engaged” has a click rate above .8%, you can safely test sending to more of that group.
🚀 Orita Grow Metrics
Revenue Lift Summary
This section summarizes additional revenue captured from Orita’s segments on a weekly and all-time basis. You’ll see:
-
Incremental revenue lift
-
Untapped revenue (missed revenue when recommendations aren’t followed)
-
Buyers you would have missed
-
% additive (new profiles emailed as a percent of your list)
-
Grow list size and adoption rate
Why it matters: These metrics help you quantify the impact of adopting Orita’s audience recommendations more fully.
-
Tip: Higher adoption rates often lead to stronger incremental lift - try removing any time-bound exclusions to maximize lift
🧪 Model Validation
Treatment Group Analysis
If you’re running A/B tests, Orita uses holdout and treatment groups to validate its models.
-
Metrics include: click rate, revenue per profile, and statistical significance.
-
Why it matters: Confirms the measurable lift, ensures Orita’s recommendations remain accurate and reliable over time, and confirms you won't lose revenue by using our tools.
📘 Need Help?
If you have questions about how to interpret your dashboard, accessing the dashboard, or how Orita’s metrics connect to your Klaviyo account, reach out to your Customer Success Manager or email cs@orita.ai